Charts with JVx and JavaFX
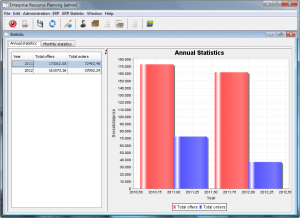
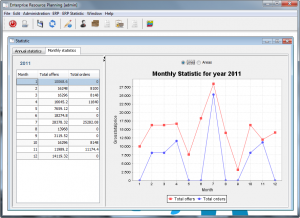
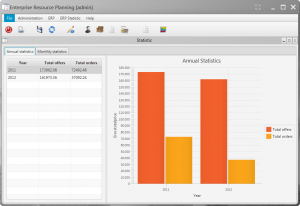
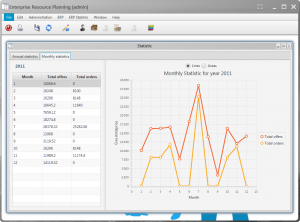
In my last article about JavaFX, JVx and data binding you saw a first impression of our chart binding. We have additional screenshots for you. The first two images show a Swing application with different charts. The next two images show the same application, with JavaFX. Which UI do you like more?
The JavaFX UI is clean and fresh. It looks modern compared to Swing. A desktop application should look modern and not dusty!
How about the data binding?
Our screen has two charts. Every chart gets its records from a data book (our model class). The labels and values are dynamic and every change in the databook updates the chart. Here's the source code for the chart definition:
UIChart chartBar.setChartStyle(UIChart.STYLE_BARS);
chartBar.setTitle("Annual Statistics");
chartBar.setXAxisTitle("Year");
chartBar.setYAxisTitle("Grosstotalprice");
chartBar.setDataBook(rdbV_statistic_order_offer_year);
chartBar.setXColumnName("YEAR_");
chartBar.setYColumnNames(new String[] {"OFFER_GROSSTOTALPRICE", "ORDER_GROSSTOTALPRICE"});
//LINE chart
UIChart chartLineArea.setChartStyle(UIChart.STYLE_LINES);
chartLineArea.setTitle("Monthly Statistics");
chartLineArea.setXAxisTitle("Month");
chartLineArea.setYAxisTitle("Grosstotalprice");
chartLineArea.setDataBook(rdbV_statistic_order_offer_month);
chartLineArea.setXColumnName("MONTH");
chartLineArea.setYColumnNames(new String[] { "OFFER_GROSSTOTALPRICE", "ORDER_GROSSTOTALPRICE" });
The complete source code is available on sourceforge. It's from our Demo ERP application.
The databooks are remote databooks because our Demo ERP is a 3-tier application. The databook definition:
RemoteDataBook rdbV_statistic_order_offer_year = new RemoteDataBook();
rdbV_statistic_order_offer_year.setName("v_statistic_order_offer_year");
rdbV_statistic_order_offer_year.setDataSource(getDataSource());
rdbV_statistic_order_offer_year.setReadOnly(true);
rdbV_statistic_order_offer_year.open();
//LINE Chart
RemoteDataBook rdbV_statistic_order_offer_month = new RemoteDataBook();
rdbV_statistic_order_offer_month.setName("v_statistic_order_offer_month");
rdbV_statistic_order_offer_month.setDataSource(getDataSource());
rdbV_statistic_order_offer_month.setReadOnly(true);
rdbV_statistic_order_offer_month.setMasterReference(
new ReferenceDefinition(new String[] { "YEAR_" },
rdbV_statistic_order_offer_year,
new String[] { "YEAR_" }));
rdbV_statistic_order_offer_month.open();
Both remote databooks are connected to a remote storage, identified by name (v_statistic_order_offer_year, v_statistic_order_offer_month). The storages are defined as server objects:
DBStorage dbsV_statistic_order_offer_year = new DBStorage();
dbsV_statistic_order_offer_year.setWritebackTable("v_statistic_order_offer_year");
dbsV_statistic_order_offer_year.setDBAccess(getDBAccess());
dbsV_statistic_order_offer_year.open();
//Name: v_statistic_order_offer_month (LINE CHART)
DBStorage dbsV_statistic_order_offer_month = new DBStorage();
dbsV_statistic_order_offer_month.setWritebackTable("v_statistic_order_offer_month");
dbsV_statistic_order_offer_month.setDBAccess(getDBAccess());
dbsV_statistic_order_offer_month.open();
Both storages read data from database views (instead of tables). The views are not magic and could also be simple tables, but our Demo ERP has views for demonstration purposes.
Here's the definition of the view, used for the BAR chart:
SELECT ofe.YEAR_ AS YEAR_,
sum(ofe.GROSSTOTALPRICE) AS OFFER_GROSSTOTALPRICE,
sum(case when ord.GROSSTOTALPRICE IS NULL
then 0
else ord.GROSSTOTALPRICE
end) AS ORDER_GROSSTOTALPRICE
FROM (v_statistic_offer ofe
LEFT JOIN v_statistic_order ord
ON (((ofe.YEAR_ = ord.YEAR_) AND (ofe.MONTH = ord.MONTH))))
GROUP BY ofe.YEAR_;
That's it. It's really simple to bind a JavaFX chart to a database table or view.


 RSS-Feed