For quite some time there has been the idea in our heads to run a stress test against a JVx/Vaadin installation to see if there are any major problems with performance and multithreading. We knew that Tomcat, Vaadin and JVx could serve a lot of users simultaneously, that's what all three were designed to do, that's what all three do well in many different environments, but we never really tried to stress it out. So we set out to change that.
The plan
Some weeks ago we started discussing and outlining how to perform such a stress test. After some research we came up with a plan:
- Design a test case using Selenium for the DemoERP application
- If necessary, design and create solutions to allow that
- Set up a Selenium Grid which can be used for testing
- Perform the actual test and fix anything that needs to be fixed
As simple as it sounds, it had quite some gotchas on the way and taught us some valuable lessons.
Name all the things
The first thing you need for automated testing are names, components need names so that they are easily identifiable by whatever you're using for testing. Already back in September we started to name components in a unique and easily recognizable fashion, our efforts are covered by ticket #1103. Of course you can still set your own names, if you want that, as the default names will only be applied if no other name is set.
In short, components are now receiving a name based on their position in the component tree. For example take this simple workscreen:
Class Name
WorkScreen: WS-XX
SplitPanel: WS-XX_SP1
Panel: WS-XX_SP1_P1
Label: WS-XX_SP1_P1_L1
Editor: WS-XX_E_COLUMN
Panel: WS-XX_SP1_P2
Label: WS-XX_SP1_P2_L1
Button: WS-XX_B_DOPRINT
The naming starts with the "root" component and every child component does append it's name. So you can easily guess where a component is assigned to, simply from its name. Every name is guaranteed to be unique, either by its position in the tree or by incrementing a counter.
Additionally there are "special snowflakes" which are getting better names, like the name of a button which is only prefixed with the name of the workscreen and a "B" and then followed by the actions which are assigned to it, e.g.
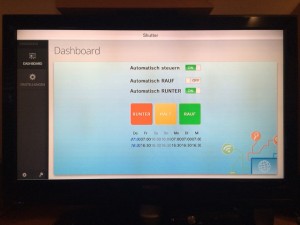
public class DashboardWorkScreen extends ...
{
...
public void initializeUI()
{
...
UIButton butUp = new UIButton("UP");
butUp.setSize(80, 80);
butUp.setStyle(new Style("up"));
butUp.eventAction().addListener(this, "doUp");
}
}
The button "butUp" will get the name Das-WV_B_DOUP. The prefix Das is the short name for the DashboardWorkScreen, followed by -WV which is like a prefix checksum/number. The letter B stands for Button and the action name DOUP is the last part.
With such a naming scheme in place, it's easy to create automated UI tests as every component is uniquely identifiable in the component tree. In the case of Vaadin the names are also used as ID's on the elements
<button type="button" class="v-nativebutton v-widget up v-nativebutton-up daswv_b_doup v-nativebutton-daswv_b_doup default-padding v-nativebutton-default-padding v-has-width v-has-height" id="Das-WV_B_DOUP" tabindex="0" style="width: 80px; height: 80px;">
<span class="v-nativebutton-caption">UP
</span>
</button>
The test case
For everyone who does not know our DemoERP application, it is a simple ERP application which features customer, product, offer and order management together with a nice statistic screen. All this can either be run as Swing application or (powered by a Tomcat Server) as Vaadin application directly in the browser.
The test case that we designed is rather simple:
- Load the application website and perform the initial login
- Open the customer management screen and add a new customer
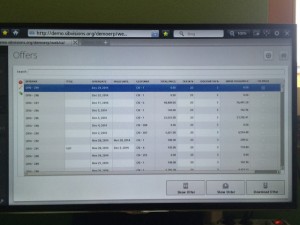
- Open the offer management screen and search for an offer
- Switch to the order of said offer and edit it
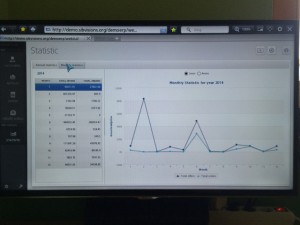
- Open the statistic screen
- Logout
This gives a nice workload for testing, as it touches close to all areas of the application, changes values nearly simultaneous and also adds data with every run. Also note that the testcase would perform these steps as fast as possible, without any artificial waiting in between.
Thanks to the Selenium IDE the test case was recorded within a matter of minutes, and quite fast copied into a unit test. The first round of testing happened with the Chromium WebDriver, which allowed us to watch the test case do its work and make tweaks wherever necessary to allow the test to succeed.
Setting up Selenium Grid
Selenium Grid (or Grid2) is a simple, scalable framework for distributed Selenium tests, allowing to control multiple browsers on different platforms. The central server is called a "hub" and the clients are called "nodes". The nodes are registering themselves at the hub, and from there a client (for example a unit test) can send a request to the hub and it will receive a node matching the requested requirements. On the client side this is happening by simply creating a new instance of a RemoteWebDriver provided by Selenium. It will automatically contact the hub, wait for a node to be ready for it and then forward all commands to that node.
This is useful if you want quickly test an application in multiple browsers on multiple platforms without leaving your IDE or to perform a simple stress test.
Setting it up is as easy as starting the hub on one machine, and starting the nodes on any other machines. We decided to go with PhantomJS as browser, as we intended to run many instances of said browser on one node and we also had a wide variety of machines, some without a GUI. PhantomJS does already have it's own built-in node, so we just needed to start PhantomJS on the machines and tell it where it can find the hub.
At the end of day we had 12 physical machines in place and we maxed them out to get a total of 82 nodes which can be used for our stress testing.
Sessions
One thing we noticed very quickly was that lingering sessions can be a real issue and the timeouts really need to be tailored to your environment. While testing we quickly noticed that sessions kept lingering on, this was less an issue for the server and Tomcat, as more for our MariaDB installation because at some point it simply stopped accepting new connections. So we needed to reduce the amount of time a session would linger on to not clog our test server.
There are two important settings controlling the amount of time a session will linger on in such a setup:
- The timeout setting of the Tomcat server
- The heartbeat interval and closing of idle sessions in Vaadin
As said, these settings should be tailored to whatever environment the server is running in. In our test environment it didn't make any sense to keep sessions longer than a few minutes, because if the test case ended or was interrupted for some reason, the session would not resume. Armed with that knowledge we reduced the amount of time a session could linger on and we could finally start the real test.
Running the test
The server in our case would be a rather unspectacular laptop, with a Core-i7 (1.80GHz) and 16 GB of RAM. Tomcat 6 would deliver the application and the data would be provided by a local MariaDB/MySQL database (with an InnoDB engine).
The test itself, which ran several times for several hours, was rather boring to be honest. 82 clients swarmed the server as fast as it could answer requests without any noticeable effect on it's performance. The laptop, despite not being the typical server machine and for sure not intended as such, could easily handle the load that 82 clients produced. We did expect the application to stay in a usable state, however we did not expect that it wouldn't have any noticeable effect at all from a users perspective.
Here is a short summary of the data we gathered (using jvisualvm and ProcessHacker):
- CPU peaked at 60%, but stood most of the time between 40% and 50%
- Tomcat peaked at 4GB RAM, but would have been able to work with as little as 2GB
- Over 21.000 datasets were created during the test run
- The GUI was not noticeably slower during the test
Our setup could handle that amount of requests with ease. Unfortunately we could not get a hold of more machines to add further nodes for now.
We broke it, we fixed it
During the tests two nasty looking issues stood out, which kept happening in roughly 1% of all test runs with seemingly no pattern behind them.
The first was a simple NullPointerException which kept happening in UIImage, but that was fixed rather easily as certain methods where not synchronized and so destined to fail.
The second was a set of Exceptions which send us to our toes: NullPointerExceptions, "Object 'offer' was not found" and "Remote storage returned 15 value(s) but 22 were expected". Clearly there was something very wrong, and with the low volume with which these exceptions occurred, it could only be a race condition somewhere. Looking for possible causes send us to all corners of the codebase without any clue in sight what might cause them.
It only dawned upon us when we got a hold of the map which did not contain the object "offer", it only contained the objects "v_statistic_order_offer_year" and "v_statistic_order_offer_month". Looking at the lifecycle objects immediately showed the problem, the session did have a completely different lifecycle object. That did also explain the wrong amount of values, as two lifecycle objects happened to contain identical named objects. But how was that possible? We immediately checked the complete source code associated with creating a session, and in AbstractSession we found the culprit. Even though the complete code for creating a session was properly synchronized where necessary, one simple statement had slipped past:
private static long lSessionCount = 0;
...
private final Long lObjectId = Long.valueOf(++lSessionCount);
For everyone not seeing the problem, here is a simplified explanation. If an object is instantiated, the fields are initialized even before the constructor is run, this is not and can't be directly synchronized. A simple increment operation (++) is compiled to six operations:
- Load a reference to a variable onto the stack
- Put into that reference the value of the static field (in our case lSessionCount)
- Put the value "1" onto the stack
- Add both values on the stack together
- Duplicate the values
- Put the new value into the static field
Six instructions, a lot of time for two threads to overtake each other and cause problems. Instantiating two sessions at once had the potential to give both the same ID. Of course we immediately fixed it and applied some other optimizations.
Another run verified that this had fixed all three issues at once and the tests were running without any further incidents for hours.
Conclusion
We were not even close to pushing the limits of what a JVx application/server can handle, and judging from the performance of the server I can only call our test setup "humble". Still it gave us a good measure of what is for sure possible and showed us that we need a bigger setup to really push the limits.
During the tests we also created various utilities to aid us with testing, unfortunately they are in a rather barebone state and can not be released by now. Also there is now a more important project awaiting, one that we think you've been waiting for for far too long.

 RSS-Feed