Application monitoring
You can build amazing applications with JVx. The framework is full-stack and supports your ALM. It has a flexible architecture, allows RAD, has built-in support for automated testing, deployment is an easy task and CI/CD are well supported.
But what happens with your applications after deployment?
Usually an application works different in production because the runtime environment is different and the amount of data grows. The number of users could be even more than in your test environment. You're well adviced if you check the deployed applications on their health, during the first few weeks or months. But it's not an easy task to check application health because reading log files or checking system parameters is not enough.
It would be best to use an application performance monitoring tool like Appdynamics or VisualVM. But such tools are complex, pro versions aren't cheap and such tools aren't specific for JVx applications.
It's horrible to check application health without a monitoring tool and it doesn't work with large applications. Or it's possible but you need too much time to find the problems.
We tried Appdynamics Lite for JVx applications and were impressed about the features, but shocked about the complexity. It's a dinosaur with millions of options. You should use a dedicated server for the tool and the machine should have extra power. Sure, the tool solves a problem but we won't use it for JVx application monitoring because it doesn't read all available information. It wasn't an option to create adapters for appdynamics because it's too complex and we love keeping things simple!
No worry, we have a simple solution for you!
It's our upcoming Application Monitoring tool. It was designed especially for JVx applications and it supports the whole server-side handling with life-cycle and server objects. The tool is a JVx application and runs with vaadin UI.
It will work with every standard Java application server and hardware requirements are as usual for JVx applications. Sure, some extra memory will be needed because analyzation of application metrics needs more resources.
Some impressions?
 Monitoring memory |
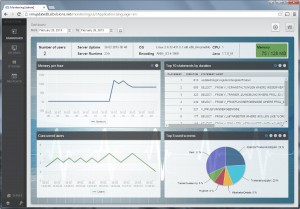
The first image shows the dashboard. It has an overview of general health and some server parameters. It shows memory consumption, concurrent user count and SQL statement statistics. This is one of the most important information about JVx applications because slow statements can slow down your application!
We show the top 10 of the slowest statements and other useful metrics.
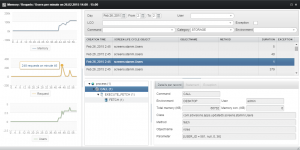
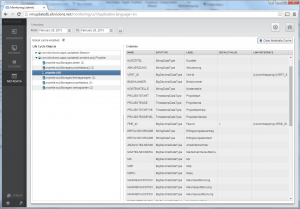
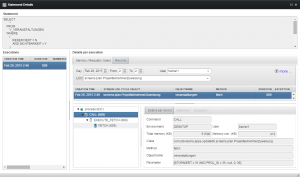
The tool allows access to the metadata cache and shows all details about server calls. Here are more impressions for you:
The application monitoring tool was designed especially for JVx applications and the server-side implementation of JVx. It's perfect integrated and doesn't slow down your application. It helps you to find the problems before your customers will find them. And it also helps with performance tuning of your application during development or after deployment in production environment.
The tool itself is not open-source and not free to use. It's a commercial addon for your JVx applications. We don't offer a lite version because tools for quality assurance should be paid. If you're interested, feel free to send us an email.


 RSS-Feed